
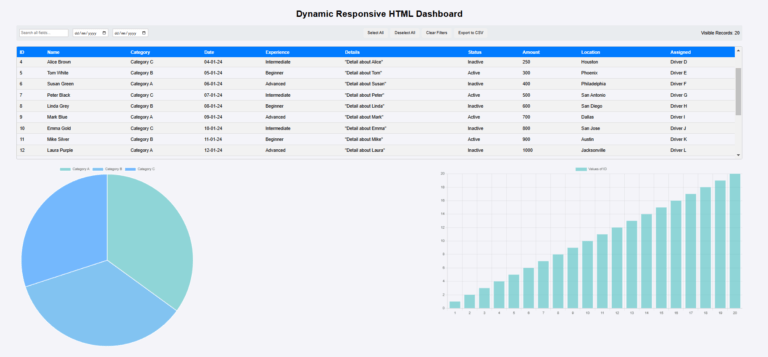
The XBOTS CSV to HTML Dashboard is a powerful and versatile tool designed to transform static CSV data into an interactive, dynamic, and visually engaging dashboard. Its intuitive interface allows users to upload any CSV file and instantly convert it into a searchable and analytical data table, complete with sorting, filtering, and date range capabilities. The dashboard’s ability to adapt to any dataset makes it ideal for businesses, analysts, and researchers who need to explore and present their data with efficiency. The seamless integration of pie and bar charts provides valuable insights at a glance, enhancing the user’s ability to interpret trends, patterns, and key metrics in real-time.
One of the most impressive features of the XBOTS dashboard is its flexibility and responsiveness. It not only allows users to customize chart fields, layouts, and themes but also ensures that data visualization adjusts dynamically to the uploaded content. This adaptability makes it suitable for diverse applications, from financial reporting to sales analytics or even academic research. The inclusion of a global search, export-to-CSV functionality, and record visibility tracking further elevates its utility. By combining data interactivity with robust analytical features, the XBOTS CSV to HTML Dashboard empowers users to uncover insights effortlessly and make data-driven decisions with confidence.
Instructions:
Notifications
